News & Events
Electrical Engineering Students' Research Presented in The Economist
 UW EE doctoral students, Po-shen Lee and Sean Yan, had their work highlighted in a June 18 edition of The Economist. The research elucidated a concept that has been presumed, but not fully tested – illustrations in academic papers affect the papers’ widespread impact.
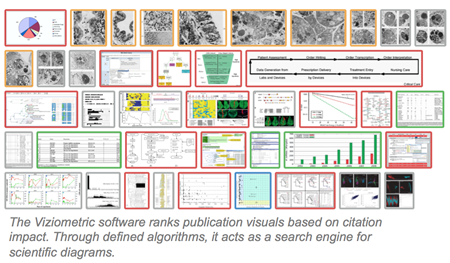
The research – termed Viziometrics – was conducted through a defined computer algorithm that distinguished various sorts of figures (photographs, diagrams, equations, etc.). They applied the algorithm to over 650,000 papers on PubMed Central (online biomedical research article archive). They measured the paper’s influence by calculating its Eigenfactor score. Google uses a mirrored, but modified, version when conducting PageRank.
The results concluded that illustrations do make a difference. However, illustrations are not all created equal. Papers with more diagrams per page tend to have greater impact. For the average PubMed Central article, one diagram for every 3 pages receives an average of 1.67 citations. Whereas, articles with an extra diagram per page receive 2 additional citations. Photographs and equations had a negative affect on influence, reducing the number of citations.
According to the article and to research author and UW Associate Director of the eScience Institute Dr. Bill Howe, these conclusions should not be considered a homogenized blueprint for all future publications. There are many different factors that may be influencers.
“It [the results] could, for example, be that papers with lots of diagrams tend to be those that illustrate new concepts, and thus start a whole new field of inquiry,” the Economist article noted. “Such papers will certainly be cited a lot. On the other hand, the presence of equations really might reduce citations.”
It is clear that this research will inspire continued study and inquiry on the affect of illustrations. The authors believe that the presence of images allows for a Rolodex of ideas, one, which, researchers can flip through as a means to gain new insights and theories, or, as Dr. Howe considers it - “the unit of scientific currency.”
So, what’s the logical next step for this diagram-focused research team? It’s a “super” figure, or an all-encompassing illustration that acts as the “tree of life” for a scientific concept or theory. Lee and his colleagues plan to utilize this comprehensive diagram to further test papers and their visual counterparts.


